
Die CNC-Prozessfähigkeit beschreibt, ob ein stabiler Bearbeitungsprozess eine definierte Spezifikation wiederholt einhalten kann; Cpk schätzt, wie gut der beobachtete Prozess innerhalb seiner oberen und unteren Grenzen zentriert ist. Ein Erstmuster kann bestehen, während der dahinterstehende Prozess driftet, außermittig läuft oder zu viel Streuung erzeugt. Deshalb sind ein konformes Teil und ein fähiger Produktionsprozess unterschiedliche Aussagen.
Für einen Käufer lautet die nützliche Frage nicht isoliert “Wie hoch ist Ihr Cpk?”. Sie lautet: Für welches Merkmal, von welcher Maschine und Einrichtung, über welchen Zeitraum, mit welcher Stichprobe, mit welchem Messsystem und nach welchen Stabilitätsprüfungen? Ein geschönter Index, der aus gemischten oder manipulierten Daten berechnet wurde, kann mehr Risiko verschleiern als offenlegen.
Drei Teile erzählen drei verschiedene Geschichten
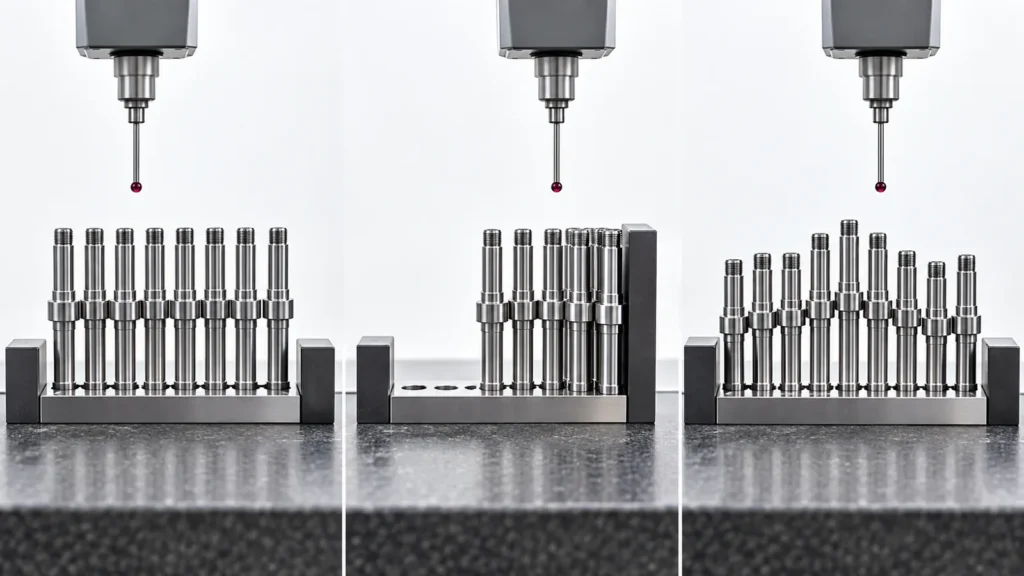 Stellen Sie sich drei Produktionslose für denselben Wellendurchmesser vor. Jedes Los enthält ein Teil, das exakt auf Nennmaß misst. Im ersten Los clustern alle Ergebnisse eng um das Nennmaß. Im zweiten liegt der Mittelwert nahe der oberen Spezifikationsgrenze. Im dritten schwanken die Werte in einem wiederkehrenden Muster, während die Maschine warmläuft und das Werkzeug verschleißt. Das Nennmaßteil aus jedem Los sieht identisch aus, aber die Prozesse sind nicht gleichermaßen vorhersagbar.
Die Fähigkeitsanalyse verwendet eine Verteilung von Ergebnissen, weil Fertigungsentscheidungen von der Streuung abhängen, nicht von einer Vorzeigestichprobe. Sie wird besonders wertvoll für Wiederholproduktion, automatisierte Läufe, Passmerkmale und Merkmale, bei denen eine kleine Verschiebung Montagefehler verursachen kann. Die Erstmusterprüfung legt einen genehmigten Ausgangspunkt fest; die Fähigkeitsarbeit untersucht, ob die Routineausgabe dort bleiben kann.
Stellen Sie sich drei Produktionslose für denselben Wellendurchmesser vor. Jedes Los enthält ein Teil, das exakt auf Nennmaß misst. Im ersten Los clustern alle Ergebnisse eng um das Nennmaß. Im zweiten liegt der Mittelwert nahe der oberen Spezifikationsgrenze. Im dritten schwanken die Werte in einem wiederkehrenden Muster, während die Maschine warmläuft und das Werkzeug verschleißt. Das Nennmaßteil aus jedem Los sieht identisch aus, aber die Prozesse sind nicht gleichermaßen vorhersagbar.
Die Fähigkeitsanalyse verwendet eine Verteilung von Ergebnissen, weil Fertigungsentscheidungen von der Streuung abhängen, nicht von einer Vorzeigestichprobe. Sie wird besonders wertvoll für Wiederholproduktion, automatisierte Läufe, Passmerkmale und Merkmale, bei denen eine kleine Verschiebung Montagefehler verursachen kann. Die Erstmusterprüfung legt einen genehmigten Ausgangspunkt fest; die Fähigkeitsarbeit untersucht, ob die Routineausgabe dort bleiben kann.
Cp misst den Spielraum; Cpk misst Spielraum und Lage
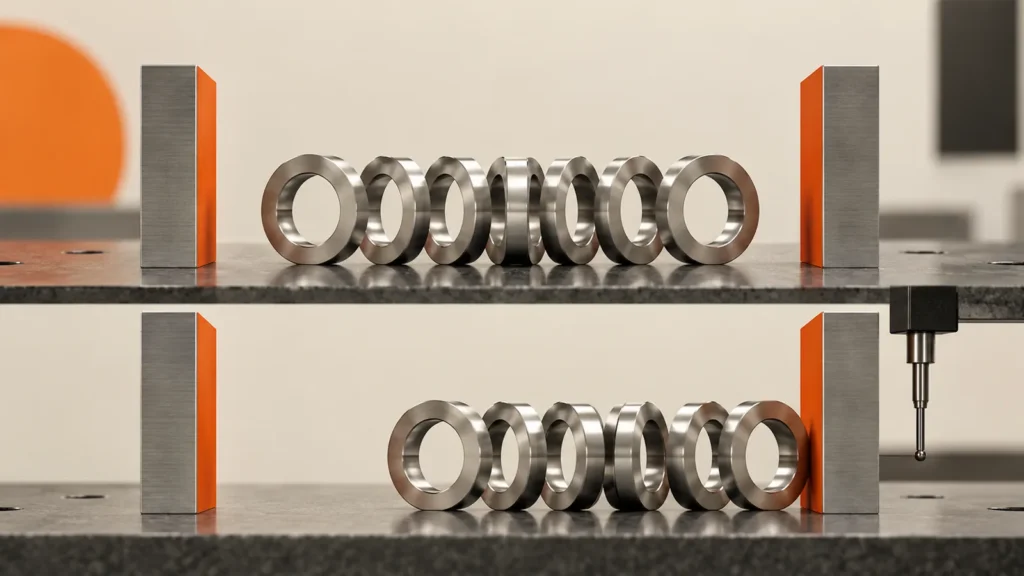 Wenn ein Prozess annähernd stabil ist und die Analyseannahmen angemessen sind, vergleicht Cp die Spezifikationsbreite mit der geschätzten natürlichen Prozessstreuung. Cpk berücksichtigt zusätzlich, wie nahe der Prozessmittelwert an der nächstgelegenen Spezifikationsgrenze liegt.
Cp = (USL − LSL) / 6σ
Wenn ein Prozess annähernd stabil ist und die Analyseannahmen angemessen sind, vergleicht Cp die Spezifikationsbreite mit der geschätzten natürlichen Prozessstreuung. Cpk berücksichtigt zusätzlich, wie nahe der Prozessmittelwert an der nächstgelegenen Spezifikationsgrenze liegt.
Cp = (USL − LSL) / 6σ
Cpk = Minimum von [(USL − Mittelwert) / 3σ] und [(Mittelwert − LSL) / 3σ]
USL und LSL sind die oberen und unteren Spezifikationsgrenzen, und σ steht für die geschätzte Prozessstandardabweichung. Ein hoher Cp bei einem deutlich niedrigeren Cpk signalisiert, dass die Streuung zwar in die Toleranz passen mag, der Prozess aber nicht zentriert ist. Wenn sich der Mittelwert weiter verschiebt, kann konforme Ausgabe unkonform werden, obwohl die theoretische Streuung schmal erscheint.
| Muster in den Daten | Was die Indizes zeigen können | Technische Interpretation |
|---|---|---|
| Eng und zentriert | Cp und Cpk sind ähnlich | Die Streuung ist klein und der Mittelwert ist angemessen positioniert. |
| Eng, aber nahe an einer Grenze | Cp höher als Cpk | Zentrierung, Offset-Strategie oder Drift erfordern Aufmerksamkeit. |
| Breit, aber zentriert | Beide Indizes niedrig und ähnlich | Die Prozessstreuung verbraucht zu viel Toleranz. |
| Trend, Zyklus oder plötzliche Verschiebung | Ein einzelner Index kann irreführend sein | Untersuchen Sie die Stabilität, bevor Sie eine Fähigkeitsaussage treffen. |
Cp und Cpk verändern die Zeichnungstoleranz nicht. Sie fassen das beobachtete Prozessverhalten relativ zu diesen Grenzen zusammen. Ein Lieferant sollte niemals eine Spezifikation erweitern, unpassende Daten löschen oder ungleiche Prozessströme vermischen, nur um die Zahl zu verbessern.
Berechnen Sie die Fähigkeit erst, wenn der Prozess stabil ist
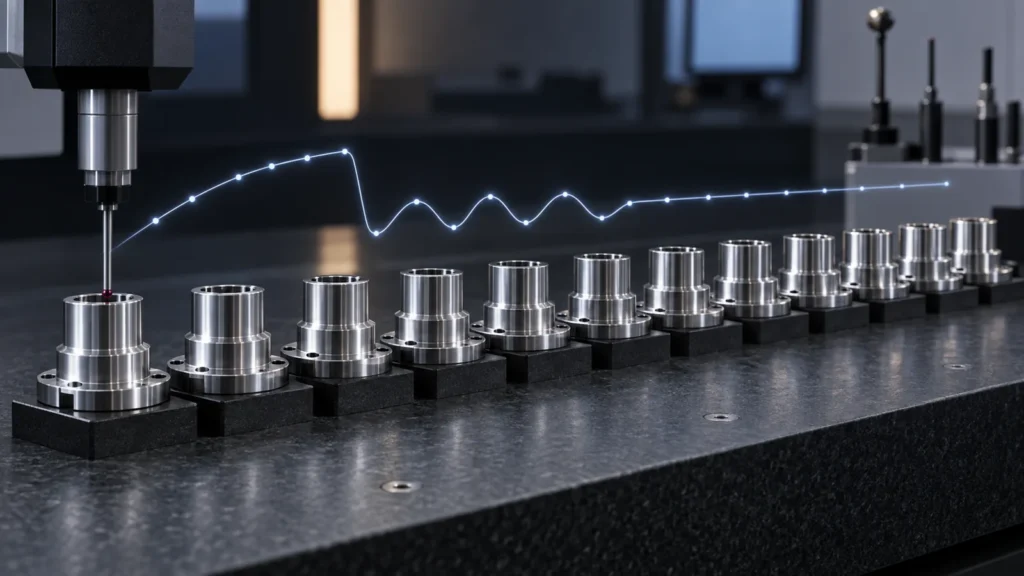 Die Fähigkeit setzt voraus, dass die Daten einen konsistenten Prozess repräsentieren. CNC-Bearbeitung enthält oft zeitbezogene Signale: Spindel- und Kühlmitteltemperaturen steigen, Schneidkanten verschleißen, Offsets werden angepasst, Stangenmaterial wechselt, Vorrichtungen werden neu geladen und Bediener starten die Produktion nach Unterbrechungen neu. Wenn diese Ereignisse Trends oder Verschiebungen erzeugen, beschreiben ein Mittelwert und eine Standardabweichung möglicherweise nicht, was das nächste Teil tun wird.
Ein zeitlich geordnetes Verlaufsdiagramm oder eine geeignete Regelkarte sollte überprüft werden, bevor Cpk interpretiert wird. Punkte außerhalb der Regelgrenzen, wiederkehrende Zyklen, lange Trends oder deutliche Cluster deuten auf besondere Ursachen oder gemischte Populationen hin. Die richtige Reaktion ist, diese Ursachen zu verstehen, nicht einen günstigeren Index aus demselben instabilen Datensatz zu berechnen.
Auch die Untergruppenbildung ist wichtig. Das Kombinieren von Ergebnissen von zwei Maschinen, mehreren Kavitäten oder Vorrichtungsstationen, unterschiedlichen Materialchargen oder Tag- und Nachtschichten kann eine Verteilung erzeugen, die zu keinem tatsächlichen Prozess gehört. Der Analyseplan sollte die Quellen erhalten, die ein Käufer zur Steuerung benötigen würde.
Die Fähigkeit setzt voraus, dass die Daten einen konsistenten Prozess repräsentieren. CNC-Bearbeitung enthält oft zeitbezogene Signale: Spindel- und Kühlmitteltemperaturen steigen, Schneidkanten verschleißen, Offsets werden angepasst, Stangenmaterial wechselt, Vorrichtungen werden neu geladen und Bediener starten die Produktion nach Unterbrechungen neu. Wenn diese Ereignisse Trends oder Verschiebungen erzeugen, beschreiben ein Mittelwert und eine Standardabweichung möglicherweise nicht, was das nächste Teil tun wird.
Ein zeitlich geordnetes Verlaufsdiagramm oder eine geeignete Regelkarte sollte überprüft werden, bevor Cpk interpretiert wird. Punkte außerhalb der Regelgrenzen, wiederkehrende Zyklen, lange Trends oder deutliche Cluster deuten auf besondere Ursachen oder gemischte Populationen hin. Die richtige Reaktion ist, diese Ursachen zu verstehen, nicht einen günstigeren Index aus demselben instabilen Datensatz zu berechnen.
Auch die Untergruppenbildung ist wichtig. Das Kombinieren von Ergebnissen von zwei Maschinen, mehreren Kavitäten oder Vorrichtungsstationen, unterschiedlichen Materialchargen oder Tag- und Nachtschichten kann eine Verteilung erzeugen, die zu keinem tatsächlichen Prozess gehört. Der Analyseplan sollte die Quellen erhalten, die ein Käufer zur Steuerung benötigen würde.
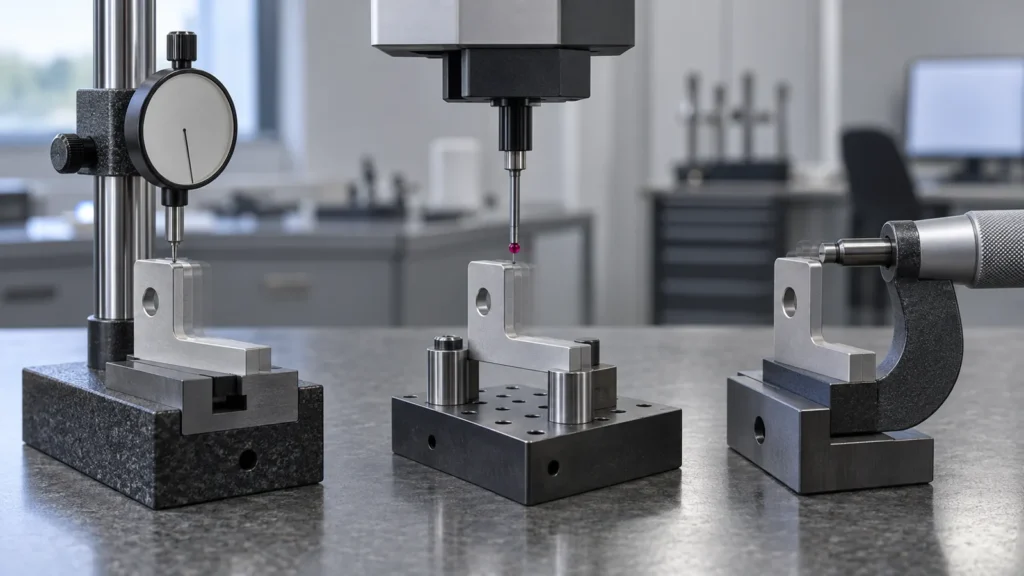 Observed variation contains both manufacturing variation and measurement variation. If an instrument lacks suitable resolution, the method is sensitive to operator pressure, or the fixture bends the part, the calculated spread may describe the inspection process as much as the CNC process.
Before requesting a formal capability result, confirm:
Observed variation contains both manufacturing variation and measurement variation. If an instrument lacks suitable resolution, the method is sensitive to operator pressure, or the fixture bends the part, the calculated spread may describe the inspection process as much as the CNC process.
Before requesting a formal capability result, confirm:
For a bore position or complex profile, the agreed CMM alignment may be part of the definition. For a simple diameter, a suitable micrometer may provide clearer production feedback. The inspection plan should support the decision rather than force every characteristic through the same device.
Tool wear turns capability into a time-dependent question
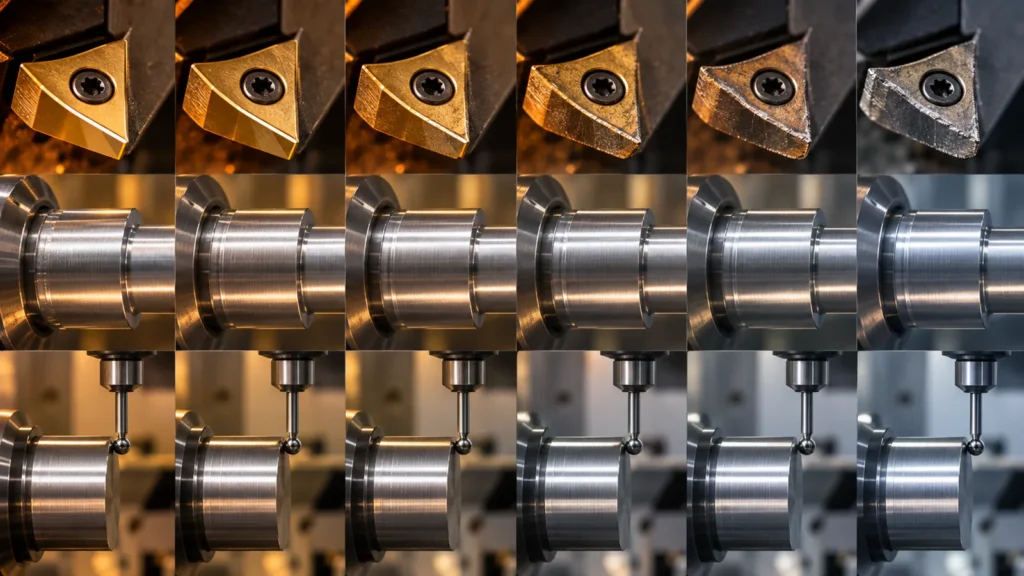 Many CNC characteristics do not vary randomly around one fixed mean. A diameter may move gradually as the cutting edge wears. A thin wall may relax after unclamping. A bore can shift as machine temperature stabilizes. A surface treatment may alter dimensions after the machining study was completed.
A capability study should therefore represent the intended production window: startup, steady running, tool changes, offset reactions, material replenishment, and any post-process stage that affects the characteristic. If the sample covers only the quiet middle of a tool-life cycle, it may overstate what the full batch can achieve.
Many CNC characteristics do not vary randomly around one fixed mean. A diameter may move gradually as the cutting edge wears. A thin wall may relax after unclamping. A bore can shift as machine temperature stabilizes. A surface treatment may alter dimensions after the machining study was completed.
A capability study should therefore represent the intended production window: startup, steady running, tool changes, offset reactions, material replenishment, and any post-process stage that affects the characteristic. If the sample covers only the quiet middle of a tool-life cycle, it may overstate what the full batch can achieve.
These controls connect statistics to the actual CNC-Bearbeitungsprozess. They become especially important in Präzisions-CNC-Produktionsbearbeitung, where tool life, multiple setups, and repeated batches must be controlled over time. Without that connection, Cpk becomes a historical score rather than a method for maintaining production.
Capability targets must follow risk and contract
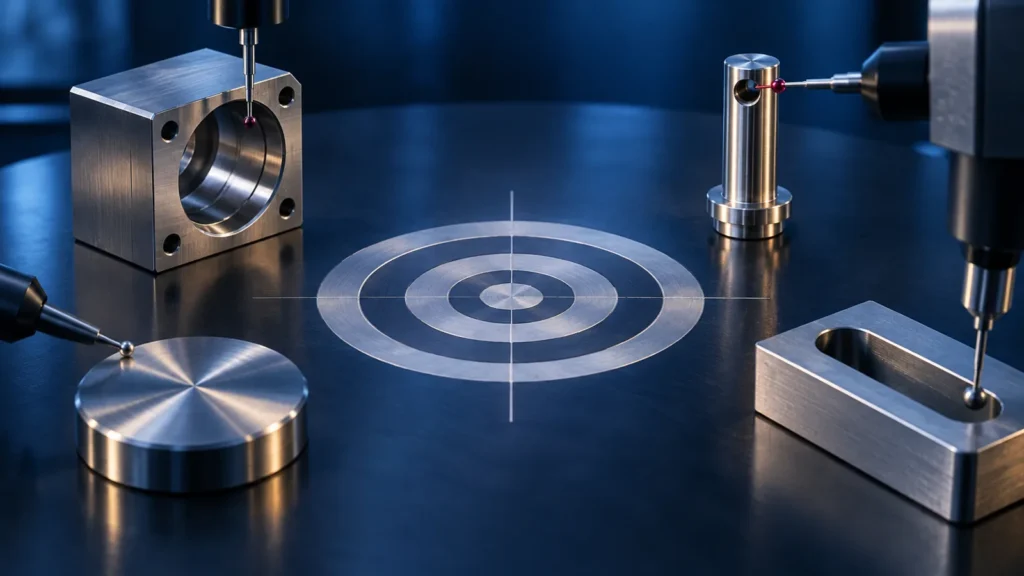 There is no universal Cpk value that automatically approves every CNC characteristic. Customers and industries may set specific thresholds, study durations, calculation methods, or response plans. A fit-critical bore, safety feature, cosmetic dimension, and generous stock-removal allowance do not carry equal consequences.
The target should be agreed with the characteristic, measurement plan, sample design, and action rule. If a required value is not achieved, possible responses include centering the process, reducing variation, changing tooling or fixturing, increasing inspection, shortening tool life, sorting the affected lot, or obtaining an approved engineering disposition. Shipping because the sample happened to pass is not a capability plan.
Tolerance design also affects feasibility. If the drawing applies an unnecessarily tight limit to a nonfunctional feature, the most sensible action may be an engineering review rather than statistical pressure on the shop. The parent Leitfaden für CNC-Bearbeitungstoleranzen explains why limits should follow function and verification needs.
There is no universal Cpk value that automatically approves every CNC characteristic. Customers and industries may set specific thresholds, study durations, calculation methods, or response plans. A fit-critical bore, safety feature, cosmetic dimension, and generous stock-removal allowance do not carry equal consequences.
The target should be agreed with the characteristic, measurement plan, sample design, and action rule. If a required value is not achieved, possible responses include centering the process, reducing variation, changing tooling or fixturing, increasing inspection, shortening tool life, sorting the affected lot, or obtaining an approved engineering disposition. Shipping because the sample happened to pass is not a capability plan.
Tolerance design also affects feasibility. If the drawing applies an unnecessarily tight limit to a nonfunctional feature, the most sensible action may be an engineering review rather than statistical pressure on the shop. The parent Leitfaden für CNC-Bearbeitungstoleranzen explains why limits should follow function and verification needs.
Study the few characteristics that reveal the process
 A capability study does not need to calculate Cpk for every drawing dimension. Start with features that affect fit, safety, sealing, alignment, interchangeability, or downstream assembly, then add characteristics that reveal known process risks. A bore diameter may show tool wear; a position tolerance may expose fixture repeatability; a thin-wall flatness result may reveal clamping and stress release.
Redundant studies add cost without adding equivalent knowledge. Several dimensions created by the same tool and setup may move together, while two visually similar diameters made in different operations can have unrelated variation. A process map helps select characteristics that represent each important source of change.
The selection should also remain practical to measure frequently. A difficult laboratory measurement may be appropriate for periodic validation, while a correlated shop-floor characteristic provides faster feedback between formal checks. If correlation has not been demonstrated, however, the convenient measurement cannot be assumed to protect the critical result. Record which characteristic is controlled directly, which is monitored as a predictor, and what evidence supports that relationship.
A capability study does not need to calculate Cpk for every drawing dimension. Start with features that affect fit, safety, sealing, alignment, interchangeability, or downstream assembly, then add characteristics that reveal known process risks. A bore diameter may show tool wear; a position tolerance may expose fixture repeatability; a thin-wall flatness result may reveal clamping and stress release.
Redundant studies add cost without adding equivalent knowledge. Several dimensions created by the same tool and setup may move together, while two visually similar diameters made in different operations can have unrelated variation. A process map helps select characteristics that represent each important source of change.
The selection should also remain practical to measure frequently. A difficult laboratory measurement may be appropriate for periodic validation, while a correlated shop-floor characteristic provides faster feedback between formal checks. If correlation has not been demonstrated, however, the convenient measurement cannot be assumed to protect the critical result. Record which characteristic is controlled directly, which is monitored as a predictor, and what evidence supports that relationship.
 A buyer should be able to reconstruct the study from the report. Look for the part and characteristic, drawing revision, specification limits, units, sample count, collection dates, machine or process stream, measurement method, time order, mean, standard deviation method, Cp and Cpk, stability evidence, excluded-data rationale, and reaction plan.
Ask what happened around the worst values. Were they consecutive? Did they follow a tool change? Was an offset adjusted during the study? Were parts measured before reaching thermal equilibrium? A distribution plot alone can hide sequence, and sequence often carries the engineering explanation.
Jucheng’s Qualitätsfähigkeiten page provides general context for dimensional inspection. A project-specific capability commitment should still be defined from the controlled drawing, batch plan, and customer requirement.
A buyer should be able to reconstruct the study from the report. Look for the part and characteristic, drawing revision, specification limits, units, sample count, collection dates, machine or process stream, measurement method, time order, mean, standard deviation method, Cp and Cpk, stability evidence, excluded-data rationale, and reaction plan.
Ask what happened around the worst values. Were they consecutive? Did they follow a tool change? Was an offset adjusted during the study? Were parts measured before reaching thermal equilibrium? A distribution plot alone can hide sequence, and sequence often carries the engineering explanation.
Jucheng’s Qualitätsfähigkeiten page provides general context for dimensional inspection. A project-specific capability commitment should still be defined from the controlled drawing, batch plan, and customer requirement.
CNC capability FAQs
Does a high Cpk guarantee zero defects?
No. Cpk estimates performance under the sampled and assumed conditions. It does not guarantee future parts, remove the need for controls, or cover characteristics that were not studied.
How many parts are needed for Cpk?
The required sample depends on the customer method, process behavior, subgroup strategy, and confidence needed. A very small sample produces an uncertain estimate and may miss tool wear, shifts, or mixed streams.
Can Cpk be calculated for a one-sided specification?
One-sided performance can be evaluated, but the calculation and interpretation should match the actual limit and customer convention. Reporting a two-sided index for a one-sided requirement can be misleading.
Why can two suppliers report different Cpk for the same tolerance?
They may use different samples, time windows, standard-deviation estimates, machines, measurement systems, or data exclusions. The study conditions must be compared before the numbers are compared.
The central lesson: capability begins with a stable, defined process and trustworthy measurements. Use Cp and Cpk to support an engineering decision about variation and centering—not as a decorative number attached to one passing batch.