
CNC process capability describes whether a stable machining process can repeatedly hold a defined specification; Cpk estimates how well the observed process is centered within its upper and lower limits. A first article can pass while the process behind it is drifting, off-center, or producing too much variation. That is why one conforming part and a capable production process are different claims.
For a buyer, the useful question is not “What is your Cpk?” in isolation. It is: for which characteristic, from which machine and setup, over what period, using what sample, with what measurement system, and after what stability checks? A polished index calculated from mixed or manipulated data can conceal more risk than it reveals.
Three parts tell three different stories
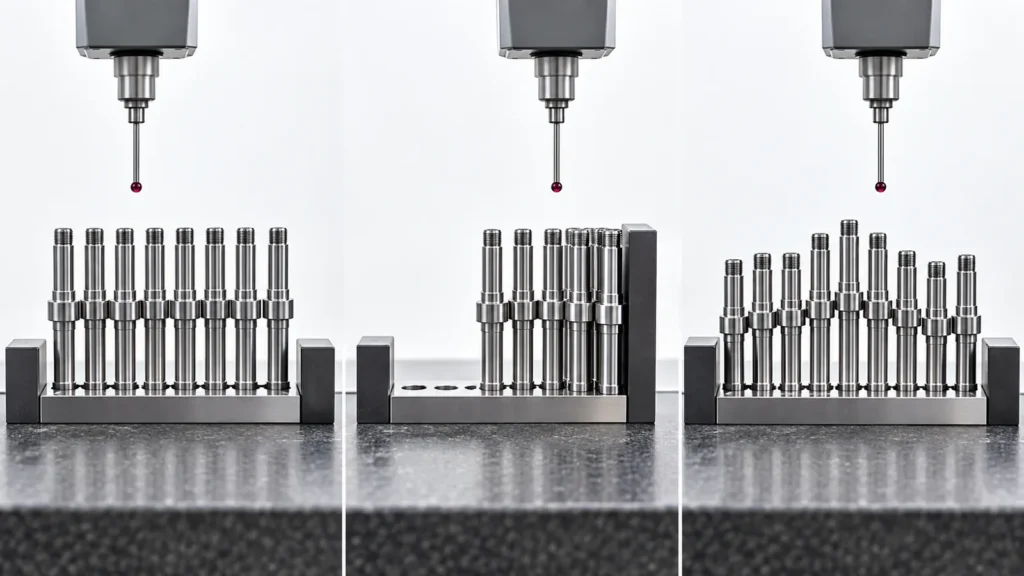 Imagine three production lots for the same shaft diameter. Each lot contains a part measuring exactly at nominal. In the first lot, all results cluster tightly around nominal. In the second, the average sits near the upper specification limit. In the third, values swing in a repeating pattern as the machine warms and the tool wears. The nominal part from each lot looks identical, but the processes are not equally predictable.
Capability analysis uses a distribution of results because manufacturing decisions depend on variation, not on a showcase sample. It becomes especially valuable for repeat production, automated runs, mating features, and characteristics where a small shift can create assembly failures. The first article inspection establishes an approved starting point; capability work examines whether routine output can stay there.
Imagine three production lots for the same shaft diameter. Each lot contains a part measuring exactly at nominal. In the first lot, all results cluster tightly around nominal. In the second, the average sits near the upper specification limit. In the third, values swing in a repeating pattern as the machine warms and the tool wears. The nominal part from each lot looks identical, but the processes are not equally predictable.
Capability analysis uses a distribution of results because manufacturing decisions depend on variation, not on a showcase sample. It becomes especially valuable for repeat production, automated runs, mating features, and characteristics where a small shift can create assembly failures. The first article inspection establishes an approved starting point; capability work examines whether routine output can stay there.
Cp measures room; Cpk measures room and position
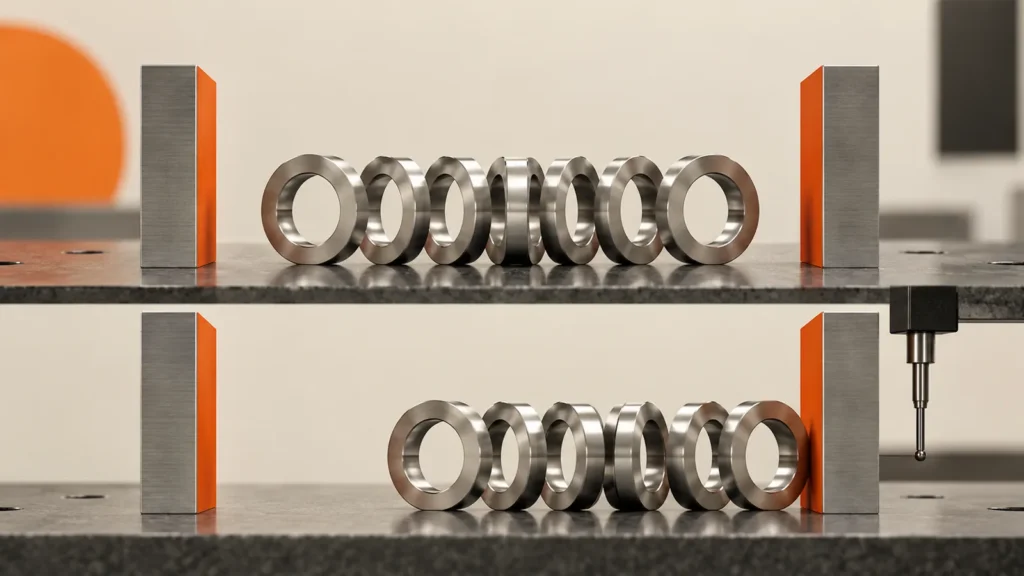 When a process is approximately stable and the analysis assumptions are appropriate, Cp compares the specification width with the estimated natural process spread. Cpk also considers how close the process mean is to the nearest specification limit.
Cp = (USL − LSL) / 6σ
When a process is approximately stable and the analysis assumptions are appropriate, Cp compares the specification width with the estimated natural process spread. Cpk also considers how close the process mean is to the nearest specification limit.
Cp = (USL − LSL) / 6σ
Cpk = minimum of [(USL − mean) / 3σ] and [(mean − LSL) / 3σ]
USL and LSL are the upper and lower specification limits, and σ represents estimated process standard deviation. A high Cp with a much lower Cpk signals that the spread may fit inside the tolerance but the process is not centered. If the average continues to move, conforming output can become nonconforming even though the theoretical spread looks narrow.
| Pattern in the data | What the indices may show | Engineering interpretation |
|---|---|---|
| Tight and centered | Cp and Cpk are similar | Variation is small and the mean is reasonably positioned. |
| Tight but near one limit | Cp higher than Cpk | Centering, offset strategy, or drift requires attention. |
| Wide but centered | Both indices low and similar | The process spread consumes too much tolerance. |
| Trend, cycle, or sudden shift | A single index can be misleading | Investigate stability before making a capability claim. |
Cp and Cpk do not change the drawing tolerance. They summarize observed process behavior relative to those limits. A supplier should never widen a specification, delete inconvenient data, or mix unlike process streams merely to improve the number.
Do not calculate capability until the process is stable
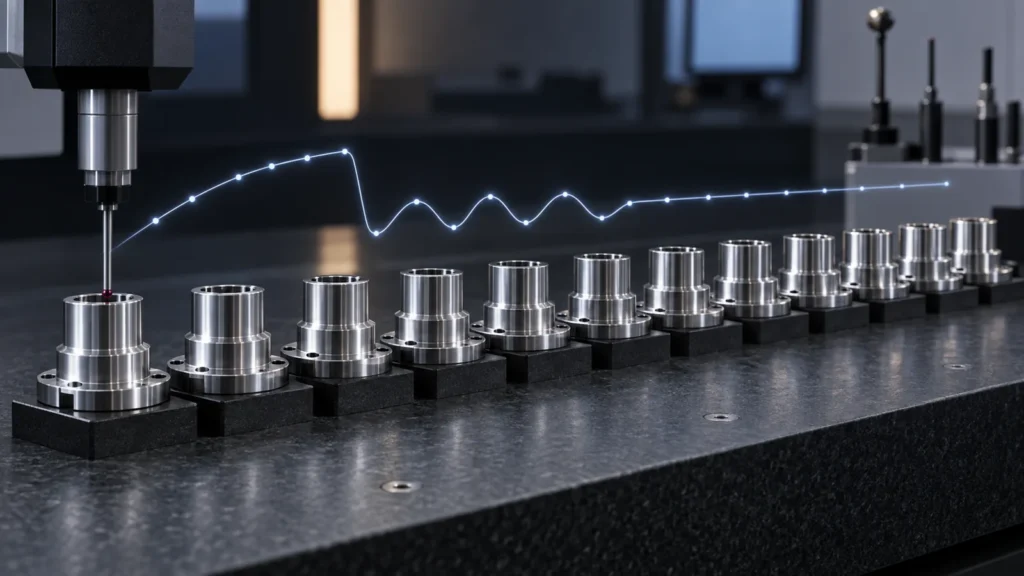 Capability assumes the data represent a consistent process. CNC machining often contains time-related signals: spindle and coolant temperatures rise, cutting edges wear, offsets are adjusted, bar stock changes, fixtures are reloaded, and operators restart production after interruptions. If these events create trends or shifts, one average and standard deviation may not describe what the next part will do.
A time-ordered run chart or appropriate control chart should be reviewed before interpreting Cpk. Points outside control limits, repeating cycles, long trends, or distinct clusters suggest special causes or mixed populations. The correct response is to understand those causes, not to calculate a more favorable index from the same unstable set.
Subgrouping also matters. Combining results from two machines, several cavities or fixture stations, different material lots, or day and night shifts may create a distribution that belongs to no actual process. The analysis plan should preserve the sources a buyer would need to control.
Capability assumes the data represent a consistent process. CNC machining often contains time-related signals: spindle and coolant temperatures rise, cutting edges wear, offsets are adjusted, bar stock changes, fixtures are reloaded, and operators restart production after interruptions. If these events create trends or shifts, one average and standard deviation may not describe what the next part will do.
A time-ordered run chart or appropriate control chart should be reviewed before interpreting Cpk. Points outside control limits, repeating cycles, long trends, or distinct clusters suggest special causes or mixed populations. The correct response is to understand those causes, not to calculate a more favorable index from the same unstable set.
Subgrouping also matters. Combining results from two machines, several cavities or fixture stations, different material lots, or day and night shifts may create a distribution that belongs to no actual process. The analysis plan should preserve the sources a buyer would need to control.
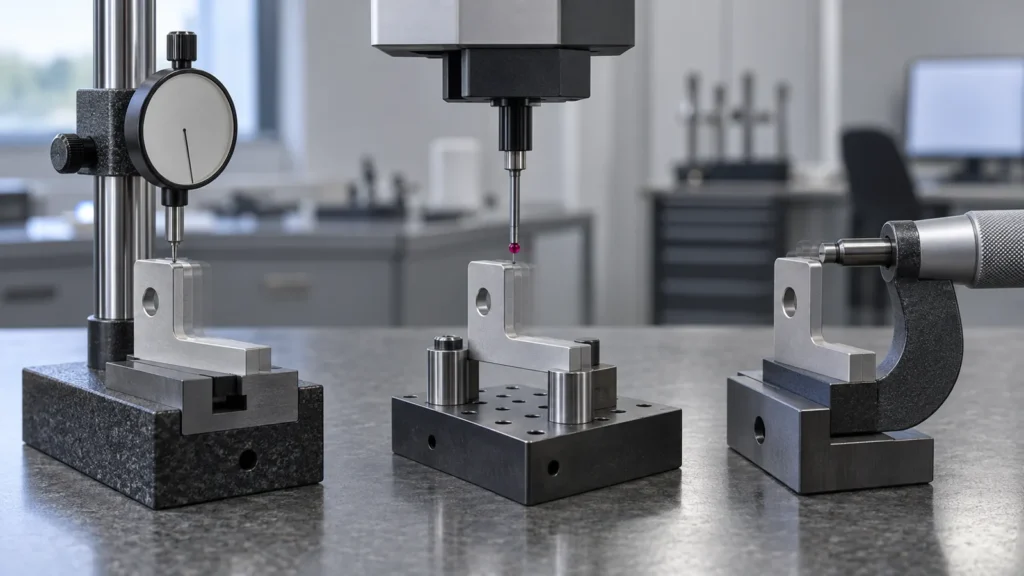 Observed variation contains both manufacturing variation and measurement variation. If an instrument lacks suitable resolution, the method is sensitive to operator pressure, or the fixture bends the part, the calculated spread may describe the inspection process as much as the CNC process.
Before requesting a formal capability result, confirm:
Observed variation contains both manufacturing variation and measurement variation. If an instrument lacks suitable resolution, the method is sensitive to operator pressure, or the fixture bends the part, the calculated spread may describe the inspection process as much as the CNC process.
Before requesting a formal capability result, confirm:
For a bore position or complex profile, the agreed CMM alignment may be part of the definition. For a simple diameter, a suitable micrometer may provide clearer production feedback. The inspection plan should support the decision rather than force every characteristic through the same device.
Tool wear turns capability into a time-dependent question
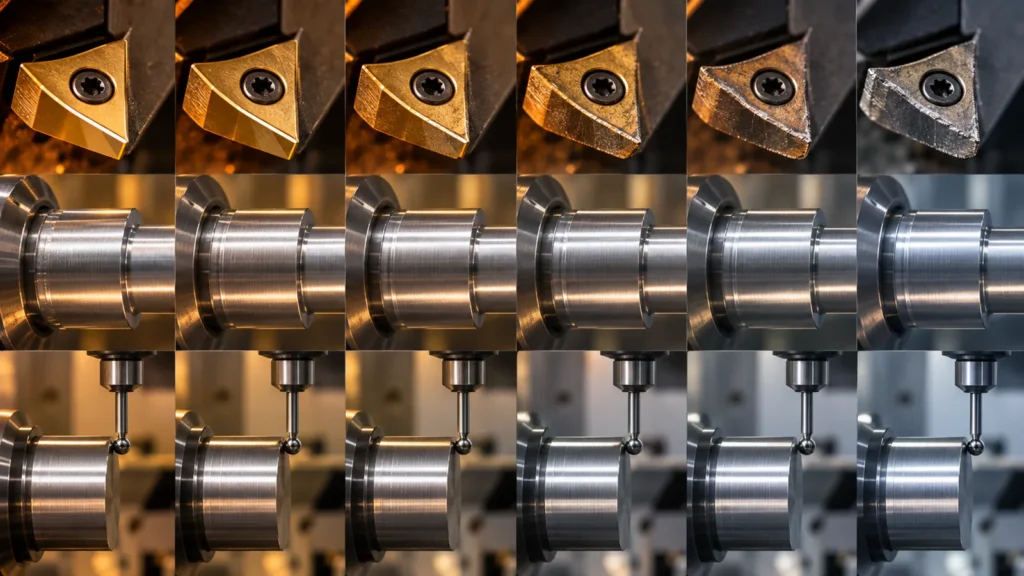 Many CNC characteristics do not vary randomly around one fixed mean. A diameter may move gradually as the cutting edge wears. A thin wall may relax after unclamping. A bore can shift as machine temperature stabilizes. A surface treatment may alter dimensions after the machining study was completed.
A capability study should therefore represent the intended production window: startup, steady running, tool changes, offset reactions, material replenishment, and any post-process stage that affects the characteristic. If the sample covers only the quiet middle of a tool-life cycle, it may overstate what the full batch can achieve.
Many CNC characteristics do not vary randomly around one fixed mean. A diameter may move gradually as the cutting edge wears. A thin wall may relax after unclamping. A bore can shift as machine temperature stabilizes. A surface treatment may alter dimensions after the machining study was completed.
A capability study should therefore represent the intended production window: startup, steady running, tool changes, offset reactions, material replenishment, and any post-process stage that affects the characteristic. If the sample covers only the quiet middle of a tool-life cycle, it may overstate what the full batch can achieve.
These controls connect statistics to the actual CNC machining process. They become especially important in precision CNC production machining, where tool life, multiple setups, and repeated batches must be controlled over time. Without that connection, Cpk becomes a historical score rather than a method for maintaining production.
Capability targets must follow risk and contract
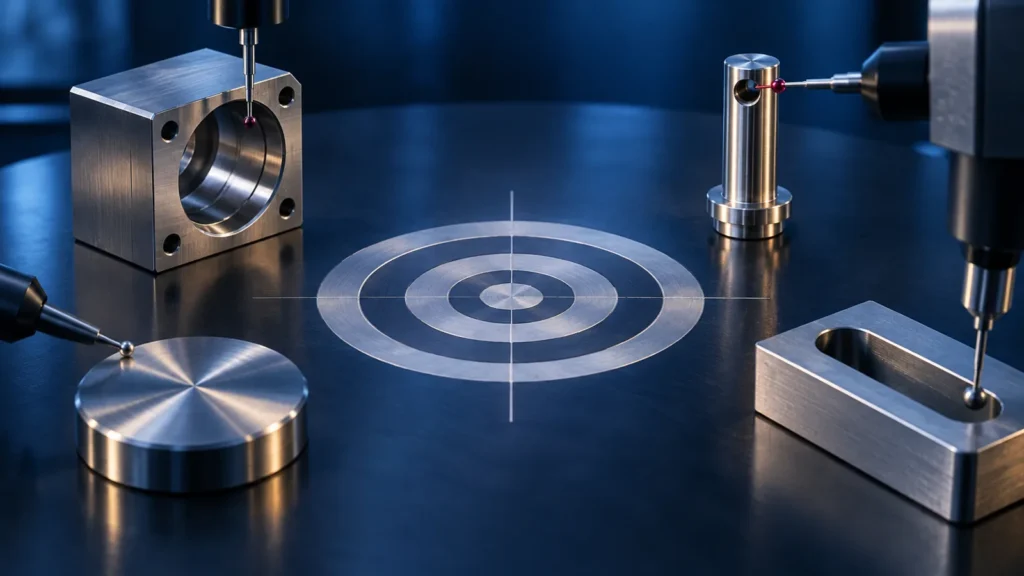 There is no universal Cpk value that automatically approves every CNC characteristic. Customers and industries may set specific thresholds, study durations, calculation methods, or response plans. A fit-critical bore, safety feature, cosmetic dimension, and generous stock-removal allowance do not carry equal consequences.
The target should be agreed with the characteristic, measurement plan, sample design, and action rule. If a required value is not achieved, possible responses include centering the process, reducing variation, changing tooling or fixturing, increasing inspection, shortening tool life, sorting the affected lot, or obtaining an approved engineering disposition. Shipping because the sample happened to pass is not a capability plan.
Tolerance design also affects feasibility. If the drawing applies an unnecessarily tight limit to a nonfunctional feature, the most sensible action may be an engineering review rather than statistical pressure on the shop. The parent CNC machining tolerances guide explains why limits should follow function and verification needs.
There is no universal Cpk value that automatically approves every CNC characteristic. Customers and industries may set specific thresholds, study durations, calculation methods, or response plans. A fit-critical bore, safety feature, cosmetic dimension, and generous stock-removal allowance do not carry equal consequences.
The target should be agreed with the characteristic, measurement plan, sample design, and action rule. If a required value is not achieved, possible responses include centering the process, reducing variation, changing tooling or fixturing, increasing inspection, shortening tool life, sorting the affected lot, or obtaining an approved engineering disposition. Shipping because the sample happened to pass is not a capability plan.
Tolerance design also affects feasibility. If the drawing applies an unnecessarily tight limit to a nonfunctional feature, the most sensible action may be an engineering review rather than statistical pressure on the shop. The parent CNC machining tolerances guide explains why limits should follow function and verification needs.
Study the few characteristics that reveal the process
 A capability study does not need to calculate Cpk for every drawing dimension. Start with features that affect fit, safety, sealing, alignment, interchangeability, or downstream assembly, then add characteristics that reveal known process risks. A bore diameter may show tool wear; a position tolerance may expose fixture repeatability; a thin-wall flatness result may reveal clamping and stress release.
Redundant studies add cost without adding equivalent knowledge. Several dimensions created by the same tool and setup may move together, while two visually similar diameters made in different operations can have unrelated variation. A process map helps select characteristics that represent each important source of change.
The selection should also remain practical to measure frequently. A difficult laboratory measurement may be appropriate for periodic validation, while a correlated shop-floor characteristic provides faster feedback between formal checks. If correlation has not been demonstrated, however, the convenient measurement cannot be assumed to protect the critical result. Record which characteristic is controlled directly, which is monitored as a predictor, and what evidence supports that relationship.
A capability study does not need to calculate Cpk for every drawing dimension. Start with features that affect fit, safety, sealing, alignment, interchangeability, or downstream assembly, then add characteristics that reveal known process risks. A bore diameter may show tool wear; a position tolerance may expose fixture repeatability; a thin-wall flatness result may reveal clamping and stress release.
Redundant studies add cost without adding equivalent knowledge. Several dimensions created by the same tool and setup may move together, while two visually similar diameters made in different operations can have unrelated variation. A process map helps select characteristics that represent each important source of change.
The selection should also remain practical to measure frequently. A difficult laboratory measurement may be appropriate for periodic validation, while a correlated shop-floor characteristic provides faster feedback between formal checks. If correlation has not been demonstrated, however, the convenient measurement cannot be assumed to protect the critical result. Record which characteristic is controlled directly, which is monitored as a predictor, and what evidence supports that relationship.
 A buyer should be able to reconstruct the study from the report. Look for the part and characteristic, drawing revision, specification limits, units, sample count, collection dates, machine or process stream, measurement method, time order, mean, standard deviation method, Cp and Cpk, stability evidence, excluded-data rationale, and reaction plan.
Ask what happened around the worst values. Were they consecutive? Did they follow a tool change? Was an offset adjusted during the study? Were parts measured before reaching thermal equilibrium? A distribution plot alone can hide sequence, and sequence often carries the engineering explanation.
Jucheng’s quality capabilities page provides general context for dimensional inspection. A project-specific capability commitment should still be defined from the controlled drawing, batch plan, and customer requirement.
A buyer should be able to reconstruct the study from the report. Look for the part and characteristic, drawing revision, specification limits, units, sample count, collection dates, machine or process stream, measurement method, time order, mean, standard deviation method, Cp and Cpk, stability evidence, excluded-data rationale, and reaction plan.
Ask what happened around the worst values. Were they consecutive? Did they follow a tool change? Was an offset adjusted during the study? Were parts measured before reaching thermal equilibrium? A distribution plot alone can hide sequence, and sequence often carries the engineering explanation.
Jucheng’s quality capabilities page provides general context for dimensional inspection. A project-specific capability commitment should still be defined from the controlled drawing, batch plan, and customer requirement.
CNC capability FAQs
Does a high Cpk guarantee zero defects?
No. Cpk estimates performance under the sampled and assumed conditions. It does not guarantee future parts, remove the need for controls, or cover characteristics that were not studied.
How many parts are needed for Cpk?
The required sample depends on the customer method, process behavior, subgroup strategy, and confidence needed. A very small sample produces an uncertain estimate and may miss tool wear, shifts, or mixed streams.
Can Cpk be calculated for a one-sided specification?
One-sided performance can be evaluated, but the calculation and interpretation should match the actual limit and customer convention. Reporting a two-sided index for a one-sided requirement can be misleading.
Why can two suppliers report different Cpk for the same tolerance?
They may use different samples, time windows, standard-deviation estimates, machines, measurement systems, or data exclusions. The study conditions must be compared before the numbers are compared.
The central lesson: capability begins with a stable, defined process and trustworthy measurements. Use Cp and Cpk to support an engineering decision about variation and centering—not as a decorative number attached to one passing batch.